What is Marketing Data? + What Data to Collect
- What is marketing data?
- Deciding what marketing data to collect
- 1. Marketing data starts with the buyers journey
- 2. Set KPIs based on your funnel
- 3. Make data decisions early in your campaign
- 4. Use Public Data
- 3 Marketing Data Examples
- 1. A Community Health Clinic: Personalized Patient Care Campaigns
- 2. A City Museum: Exhibits for Community Interests
- 3. A Nonprofit Focused on Homeless Rehabilitation: Success Story Spotlight
- Data is what you make it
- Marketing data is dandy, but insight is everything.
We love marketing data here at Big Sea. Conversion ratios and click-through rates are our jam. But having a lot of data doesn’t add up to better marketing unless it’s the right data. And to get the right data, you have to be tracking the right key performance indicators for each specific type of content you produce.

What is marketing data?
Marketing data is any data collected about marketing efforts that helps you understand, describe, improve, and reproduce them. Colloquially, when people discuss marketing data, they probably mean a handful of things:
- Demographic Data: Who are you trying to understand better? Demographic data covers essential information such as people’s names, ages, income, location, education, etc.
- Account-based Data: Who are you? Data about the organization itself including company name, location, size, classification, industry, revenue, etc.
- Sales & Pipeline Data: Who is in your pipeline, and how does your pipeline work? Data about leads, contacts, closing rates, etc.
- Chronographic Data: What’s happening? Data about important events that could impact insights into other marketing data, such as holidays, company mergers, company acquisitions, new drives and campaigns, etc.
- Web Analytics & Intent Data: What happens on your website? How do they get there? Data about visitors, sessions, clicks, engagements, downloads, purchases, forms, etc.
- Proprietary vs. Public Data: Proprietary data is information where the rights to the data are restricted, whereas public data is open access.
What is the difference between qualitative vs. quantitative data?
Deciding what marketing data to collect
- Start with the buyers journey
- Set KPIs based on your funnel
- Make data decisions early in your campaigns
- Using public data
- Marketing data examples
1. Marketing data starts with the buyers journey
Enthusiastic but inexperienced marketers—or salespeople posing as marketers—view “conversions” or “sales” as the Holy Grail of all metrics. Expecting that a blog will convert a visitor into a customer, and will do so at the same rate an ebook will convert nurtured leads into customers, is unrealistic. Blogs drive new traffic and encourage return visits. They’re not supposed to sell, so stop measuring their conversion rate.
Before you set a single KPI, map out where each piece of content falls in your buyer’s journey and what the next realistic step is for the buyer after engaging with the content. An easy way to do this is to first put all of your content in a persona journey matrix.
How do you map a buyers journey?
The kind of data you collect (and will be able to collect) will depend on the stages of your buyers journey. Each buyers journey will be unique to their organizations. However, here are some key players that appear in many buyers journeys:
- New visitors: People who are just discovering your brand/website for the first time.
- Leads: People who have the potential to become a client.
- Qualified Leads: A prospect generated by the marketing team that has been vetted by the sales team.
- Customers: Someone who has completed a sale in the past, and often someone you want to re-target in the future.
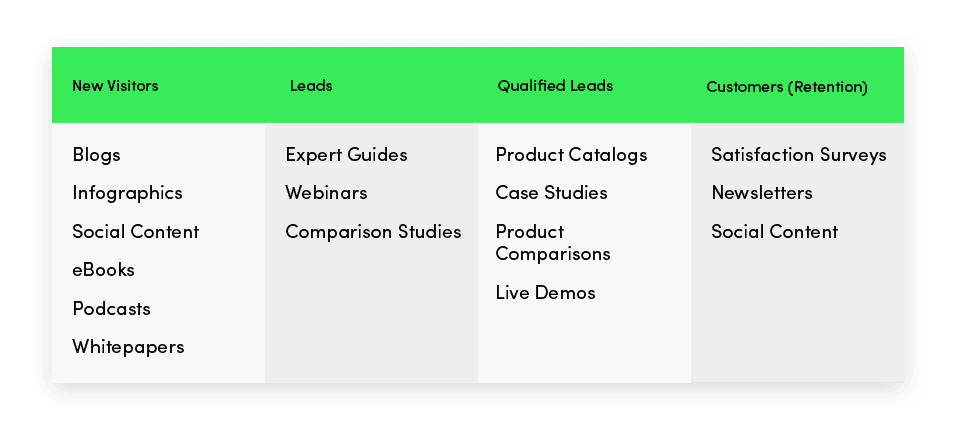
What type of content is consumed at each stage of the journey?
Knowing what kind of marketing data you want to collect about your own campaigns hinges on understanding who will be seeing what types of content. The goal is to better understand how they’ll move through the pipeline. Here’s a quick refresher on the types of content you might have and their traditional function in the buyer’s journey.
2. Set KPIs based on your funnel
The second pitfall marketers fall into is paying equal attention to all the data. There is an overabundance of data available when it comes to digital marketing. You can track everything: views, sessions, new visits, returning visits, sources, referrals, times, clicks, comments, likes, and on and on it goes.
When you measure everything, it’s difficult to decipher which data points reflect movement toward your goals.
The solution is to measure what matters for each type of content. Conversion ratios don’t matter to blogs, but the indicators below do. They show interest, commitment and appreciation. Those emotions can motivate a visitor to take the next step and download a white paper or sign up for a newsletter.
What are KPIs?
Key Performance Indicators (KPIs) are data you select that are important to the goals of your organization. They can include things like
- Visits (obviously)
- Time spent on page
- Depth of scroll
- Social shares
- Comments
Generally, KPIs also come with benchmarks for health or growth. For instance, a KPI is probably not time spent on a page, but a goal to increase that time by some amount over some period of time, let’s say 10% over a quarter.
Example KPIs
The marketing data you should collect will depend on your KPIs at each stage of the buyers journey. For example, visits to a website are not very important metrics when it comes to figuring out how to optimize close rate. But they might be for generating pipeline. Here are some examples types of data you can use to set KPIs at each stage of the buyers journey:
- New visitors: Traffic to blogs. Use page flow insights to see how visitors are moving through your website.
- Leads: Click through rate on a blog to webinar sign up or e-book download.
- Qualified Leads: Views of case studies, demos. Submissions to online contact forms.
- Customers: Email open and click through rates. Email traffic to website. Social shares and comments.
3. Make data decisions early in your campaign
Early-stage data decisions impact everything from campaign tuning, resource allocation, to customer experience and beyond. Essentially, the sooner you identify what information you require, the more streamlined and targeted your campaign strategy will be, avoiding costly, mid-campaign adjustments that can result from a lack of foresight.
Making data-informed decisions from the outset involves outlining the key performance indicators (KPIs) that are most relevant to your campaign’s goals. These could range from engagement metrics like click-through rates for a digital campaign, to foot traffic in a store for a physical marketing effort. By choosing early, you’re not just setting targets but also establishing the context in which your campaign will operate.
Furthermore, early data decisions ensure consistency and relevance in message and engagement strategy across various channels. In a multi-channel or omnichannel campaign, each touchpoint should relay coherent messaging that resonates with the data-understood behavior and preferences of the target audience. This harmonization is only possible if the team has clear data directives from the start, ensuring each channel is not only aligned with the campaign’s overall objectives but also responsively tailored to the audience’s real-time journey.
4. Use Public Data
Public data is open access data that is made freely available by the collector or organization behind the data. A lot of the data collected by the government is public data, for example. But individuals and independent groups can also make their datasets free to the public as well. At some point, you’re going to need to collect public data in order to understand your buyers and market.
Here’s a few examples of how public data is commonly used in business and nonprofit organizations:
1. Competitive Data: Public data is crucial in monitoring competitors. Companies analyze public financial records, patent filings, employment stats (from labor departments), and digital footprints to assess competitors’ market positions and strategies. This intelligence informs a company’s own marketing strategies, helping to differentiate their messaging, identify competitive gaps, and highlight unique selling propositions.
2. Analysis for Actionable Insights: By keeping an eye on public data related to regulatory changes, economic forecasts, and societal shifts, companies can anticipate risks and navigate their marketing strategies accordingly. This foresight can help companies avoid campaigns that could be poorly timed or sensitive, thereby protecting brand image and customer relationships.
3. Content strategy refinement: Content marketing benefits from the depth and breadth of insights derived from public data. By understanding what matters to their audience, companies can craft content that is both engaging and valuable. Trends gleaned from public sources can inform topics, tone, and delivery channels, making content efforts more aligned with audience needs and interests.
4. Regulatory compliance and ethical positioning: Finally, by monitoring updates in public data around regulations and societal issues, companies stay ahead in compliance and ethics. This proactive stance not only prevents legal issues but also positions the brand as responsible and trustworthy in its marketing communications.
3 Marketing Data Examples
Having trouble envisioning what marketing data to collect? Here are three different examples so you can start to generate ideas for your own organization.
1. A Community Health Clinic: Personalized Patient Care Campaigns
Background: A community health clinic provides critical healthcare services within a region known for its underserved populations. The clinic relies on patient fees, government subsidies, and donations to fund its operations.
Using Marketing Data: By analyzing patient data (within HIPAA compliance), the clinic identifies common health issues affecting its community. It also uses demographic data to understand the community’s composition in terms of age, family size, income levels, and preferred communication methods.
Strategy and Implementation: The clinic launches a personalized healthcare campaign, using its insights to inform content and outreach methods. For example, for families in lower-income brackets, it promotes a subsidized health check program. For middle-aged adults, it provides preventative health workshops addressing common chronic conditions identified in the patient data. The campaign is disseminated through community events, local media, and social media, guided by the demographic preference for information sources.
Revenue Increase: The personalized approach drives patient engagement, increasing visits and participation in paid programs, thus boosting patient-generated revenue. Additionally, demonstrating impact and community engagement attracts more funding and donations as the clinic is seen as proactive and essential in the community.
2. A City Museum: Exhibits for Community Interests
Background: A city museum, funded by entry fees, donations, and sponsorships, strives to be a valued cultural hub. However, fluctuating attendance and stagnating revenue streams present ongoing challenges.
Using Marketing Data: The museum starts by analyzing online engagement, using website analytics, social media interactions, and online surveys. It identifies a growing interest in local history, particularly among younger demographics. However, it also recognizes that this audience prefers digital engagement and online experiences to decide on their visits.
Strategy and Implementation: Based on these insights, the museum decides to digitally transform its marketing approach. First, it creates a virtual tour of their upcoming exhibit on local history, including teaser content like behind-the-scenes videos, curator talks, and interactive web content. To reach the younger audience, it launches a social media campaign using targeted ads, influencer partnerships, and hashtags that encourage online interaction.
The museum also leverages email marketing, sending out invitations to their digital content and offering online booking specials for the exhibit. A mobile app is introduced, enhancing the visitor experience by offering an interactive exhibit guide, and it’s promoted via all digital platforms.
Additionally, the museum hosts online events leading up to the exhibit opening, such as webinars with historians, interactive Q&A sessions, and live-streamed sneak-peeks, creating buzz and engagement.
Revenue Increase: This digital strategy significantly broadens the museum’s reach, driving traffic to both the website and physical exhibit. The interactive content and online community building create a sense of inclusion, especially among younger audiences, leading to increased digital engagement and physical visits.
3. A Nonprofit Focused on Homeless Rehabilitation: Success Story Spotlight
Background: A nonprofit organization dedicated to rehabilitating homeless individuals relies on grants and public donations. They seek to increase funding to expand their capacity.
Using Marketing Data: The organization uses data from success stories, testimonials, and community feedback, analyzing the most impactful aspects of its program. Public data on homelessness, employment rates, and cost of living are also considered.
Strategy and Implementation: The nonprofit initiates a “Success Story Spotlight” campaign, sharing narratives of individuals who have successfully reintegrated into society through their programs. These stories are shared through video content, blog posts, and social media campaigns, and are also sent directly to past and potential donors through email newsletters.
Revenue Increase: The emotive, success-driven content resonates with the community and potential donors, leading to an increase in donations. By showcasing the direct impact of donations through real-life stories, the organization reinforces donor trust and likelihood of recurring contributions, creating a sustainable revenue model.
Data is what you make it
Metrics are raw material. Much like lumber is only stacks of wood without a builder, data is only numbers until you analyze it in the context of your goals and your audience. A dip in views might initially be viewed as a negative. Your keywords aren’t working, your blog isn’t driving traffic. Maybe, or maybe the targeted, long-tail keywords in your content are attracting more potential customers and fewer visitors who immediately bounce. Which is more important, page views or actions taken after the view?
Don’t get so caught up in chasing the numbers that you forget to put them in a larger context. It is only when we do so that we can accurately call our findings “insights.”
Marketing data is dandy, but insight is everything.
Need help deciding which metrics matter to your company’s marketing goals? Drop us a line! We can help you map your buyer’s journey, identify KPIs, and build insightful masterpieces from your data.